
TimelineJS is an open-source tool for building visually rich, interactive timelines. Similarly, StorymapJS is a tool for using maps to tell stories. These tools work well for presenting history in multi-media ways and for building collaborative projects. Our faculty and students have had great success using these tools and others.
We proudly share the case study of Professor Beth Pollard’s HIST 503: “Roman History” course as an example of using TimelineJP and Storymap JS:
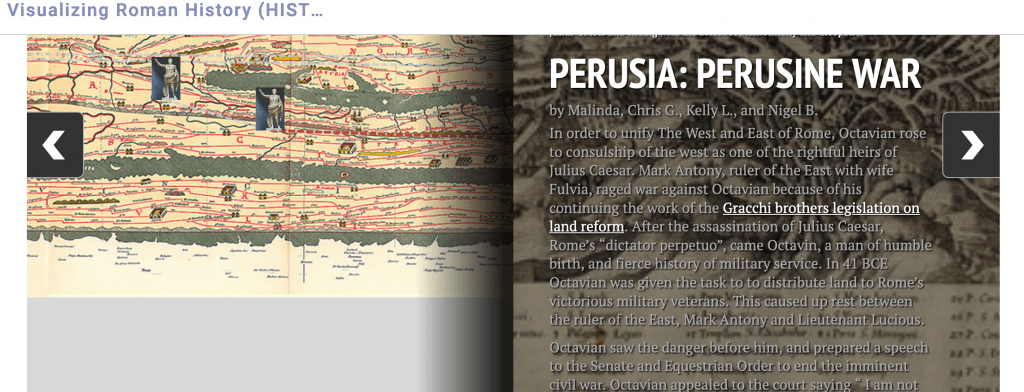
This website: “Visualizing Roman History: Scaffolding for Success” shares the collaboration between Beth Pollard and Pam Lach to scaffold a series of low-stakes digital humanities workshops and projects into an upper-division Roman History course using TimelineJS and StoryMapJS. The goal was to prepare students to create a high-stakes DH project of their own by the end of the semester. The website describes the various stages of the process from earliest planning, to the creation of help-sheets and assignment directions with clear learning goals, in-class workshops, and final products; it includes embedded examples and process blog + assignment and assessment rubric. Take a look!
StoryMaps:
ESRI StoryMaps is similar to StoryMapJS, and can be accessed with your SDSUid.
Professor Sureshi Jayawardene (Africana Studies) successfully and robustly used StoryMaps in her AFRAS 421: “The Black Urban Experience” (See below)
Assignment from AFRAS 421, “The Black Urban Experience”: The project must focus on a US city of your choice where African Americans have made considerable contributions to the culture, character, and social climate of the urban space. Your StoryMaps must then be developed to highlight 5-8 aspects of the city in order to create balance in the narrative. These aspects include: the city’s founding, any early industrial or agricultural emphases, processes or phases of development, major infrastructure, what this city is currently known for, shifts in demographics, significant legislative shifts, major debates and/or contemporary issues, city planning efforts, policy concerns, future outlooks, and so forth. These should be both historical and contemporary in nature. To build your narrative, you will need to consult 6-7 sources, the majority of which need to be academic (i.e., peer-reviewed journal articles, academic monographs, chapters in edited volumes/anthologies). Graduate students will need to use 8-12 sources. This assignment requires a mix of maps, images, videos, and texts to illustrate your narrative. To read more about Professor Jayawardene’s assignment and scaffolding of it, click here.
More resources:
- Step-by-step tutorials (Google docs) with links for TimelineJS and StoryMapJS (by Pam Lach, Spring 2020, HIST 455)
- SDSU ESRI Login
- ESRI StoryMaps Tutorials
- Fall 2021 Tool Refreshers on TimelineJS and StoryMapJS with Pam Lach
Faculty points of contact:
- Sureshi Jayawardene (Africana Studies). sjayawardene@sdsu.edu
- Elizabeth Pollard (History). epollard@sdsu.edu
- Pam Lach (DH Librarian). plach@sdsu.edu